


2 + 2[1] 40. RefreshR
visual with source)
editor: sourceinstall.packages()install.packages("tidyverse")
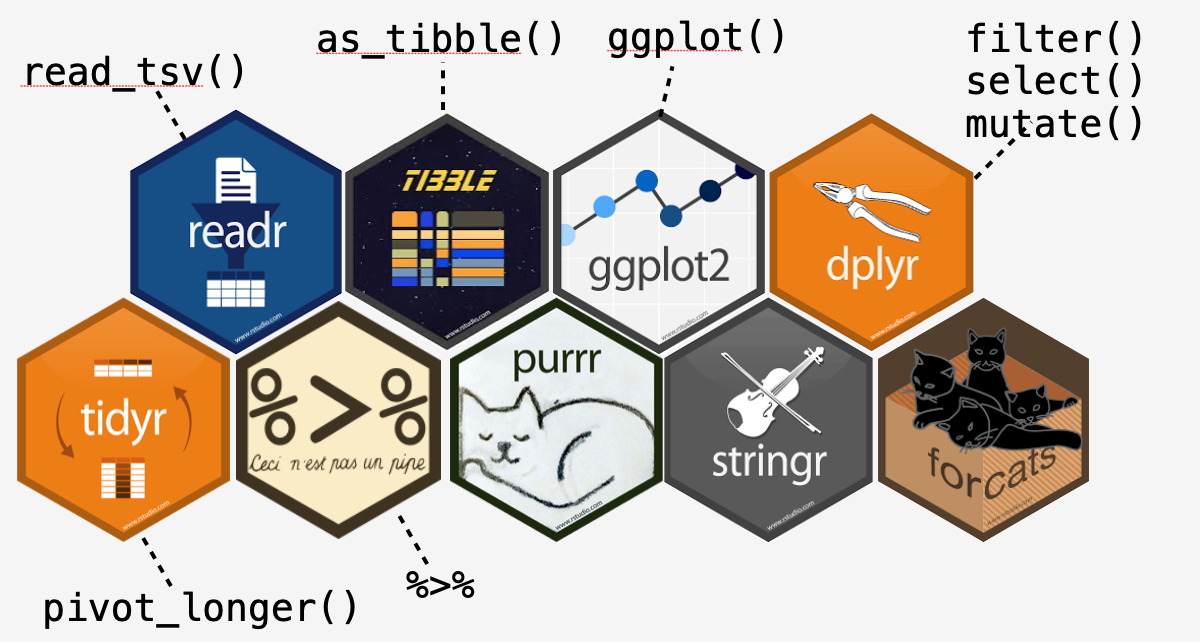
install.packages("easystats")tidyverse1 and easystats2 are actually collections of packageslibrary()
pkg::fun()Tip
It is good practice to explicitly mention a function’s package when using it, e.g. dplyr::select(), especially when using less popular functions.
![]()
ggplot2 is the main R package for data visualizationggplot()
+x=Sepal.Length, not x="Sepal.Length")
library(tidyverse)

ggplot(iris, aes(x = Sepal.Length, y = Sepal.Width)) +
  geom_point() +
  geom_density_2d() +
  theme_classic()
ggplot() are inherited by the layersggplot() +
geom_point(data=iris, aes(x = Sepal.Length, y = Sepal.Width)) +
geom_density_2d(data=iris, aes(x = Sepal.Length, y = Sepal.Width)) +
theme_classic()ggplot(iris, aes(x = Sepal.Length, y = Sepal.Width)) +
geom_point(color="yellow", size=4, shape="triangle") +
geom_density_2d(color="red") +
see::theme_abyss() # Package in easystatsWarning
Misnomer: do NOT confuse arguments that are “aesthetics” in aes() (i.e., map variable names to aesthetic features) with arguments that control the appearance of the plot (not in aes())
ggplot(iris) +
  geom_point(aes(x = Sepal.Length,
                 y = Sepal.Width,
                 color="blue"))
ggplot(iris) +
  geom_point(aes(x = Sepal.Length,
                 y = Sepal.Width),
             color="blue")
scale_*()iris |>
ggplot(aes(x = Sepal.Length, y = Sepal.Width, color=Species)) +
geom_point(size=3) +
scale_color_manual(values=list(setosa="orange",
versicolor="purple",
virginica="green")) +
see::theme_abyss()
Thank you!
![]()

