Neuropsyχart©
Body & Mind Art.
NeuropsyXart© offers a direct insight into our internal realities.
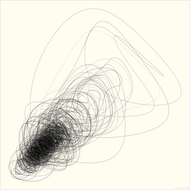
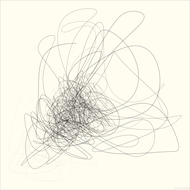
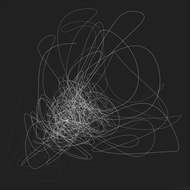
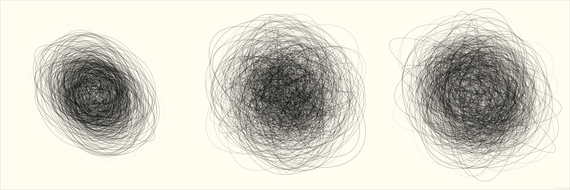
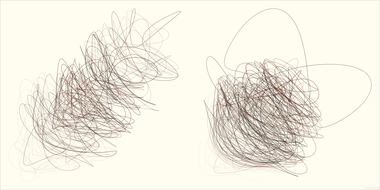
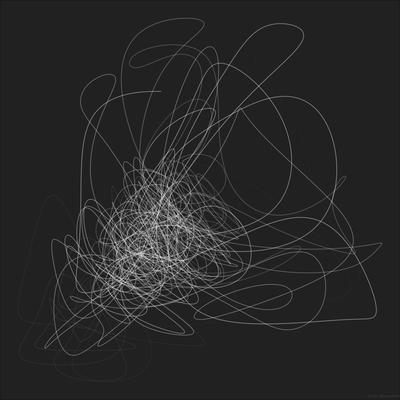
From the recording of one’s heart or brain, Dr Dominique Makowski creates a visual representation of the unique neurophysiological state at a specific moment, in a specific person.
About
NeuropsyXart© (pronounced “neuro-psych-art”) is an art form created by Dr Dominique Makowski that combines latest neuroscientific knowledge, advanced neuroimaging methods, and cutting-edge data-processing algorithms to create visual artworks that are inherently unique, idiosyncratic, and personalized to each client (the art’s object). It is a paradigmatic reversal of traditional art, in which the artwork is the result of the artist’s mind (creativity) and body (technical skills). In NeuropsyXart©, the artwork is the result of the subject’s mind or body, and the artist is merely but a facilitator, a tool.
The subject engages in a mental experience, such as thinking about a loved one, contemplating one’s goals and desires, watching a movie, or simply relaxing. During this mental experience, its peripheral (i.e., bodily) or central (i.e., brain) activity is recorded, for instance via ECG or EEG.
The signals acquired during that experience are submitted to method used by neuroscientists to understand the complex, chaotic and fractal nature of physiological signals. A unique visual representation of the mental or bodily activity, such as “an attractor”, is produced.
Procedure
Interested in being the art’s object? What to expect
NeuropsyXart© is an art form that, more than any other else, engages both the artist and the client, who is the art’s object. The end-result (the artwork) is the materialization of the client’s mind & body.
If you’re interested in having your unique mental experience turned into an art work, feel free to contact me for more information.

Attractors
Physiological Signals and Attractors
From Physiological Signals to Attractors
We are made of oscillating signals. The neurons in our brain, which give rise to our rich mental life, communicate via electrical impulses, which can be recorded as a signal with a complex oscillatory pattern made with multiple frequencies. But the brain activity is not the only thing that oscillates. Many other physiological functions operate via “cycles”, such as heart rate or breathing. Interestingly, our body and brain rhythms exhibit a complex structure, made of changing self-repeating patterns. In fact, it seems that it is deterministic chaos, not homeostasis, is the “wisdom of the body” (Goldberger, 1991).
One recent approach, stemming from theoretical mathematics and applied physics, has made its way into neuroscience to help us understand the complex patterns of the signals. Chaos-theory, and non-linear dynamics, came with new ways of describing these patterns, with concepts such as entropy or fractal dimension.
One of the key idea is to move away from a representation of these signals as a (physiological) system which activity unfolds over time but, instead, to characterize the trajectory of the system in a multidimensional space defined by its current and past state(s).
To illustrate this idea, let us consider the above signal. We can start by plotting the the value of the signal at t0 on a different figure, as the y-axis (the vertical one). As you can see from the animation below, the height of that point is equal to the value of the signal at t0.
What we are now interested to do is to represent this red state (t0) in relationship to a past state. For that, we will select the a state delayed by a given duration (t-1). We can graphically represent this by moving associating that paste state to the horizontal axis in the right figure.
This means that the location of the purple point in that 2-dimensional space combines, through its x and y coordinates, the value of the current state (t0) with that of its past state (t-1).
We can now graph the evolution, i.e., the trajectory, of the signal in that state-space. As we can see, although the signal is oscillating in complex fashion, its dynamics show a clear pattern. Moreover, we can also easily that, towards the middle of the clip, the signal returns to its initial state and its trajectory overlaps (which is not obvious from the signal graph alone).
The right figure is referred to as an attractor plot, because often the signals' trajectories are contained within a fairly well-defined space that they do not leave, no matter the duration: this represents the boundaries of the system at the origin of the signal.
We can now add a third dimension to represent the same of the system 2-times before the current state (t-2). We can visualize this by adding a third axis to the attractor plot (the depth), making it 3D.
We can technically continue to add more dimensions to track deeper past states and get a better representation of the dynamics of the system, but it becomes hard to graphically represent, as our limited minds can hardly visualize beyond 3-Dimensions. However, most physiological systems, like the ones from our bodies, require no-more than a handful dimensions. More often than not 2 or 3 are enough to obtain an accurate representation of the system’s dynamics.
One important thing to note is that the attractor’s aspect is strongly influenced by the choice of the delay value (the time between a current state and its past state). You can see in the animation below how the attractor of the same signal changes depending of the chosen value. You can also remark that, although it changes shape, some features and geometric patterns remain present throughout.
Describing Attractors
In NeuropsyXart©, we use specific algorithm to estimate the optimal parameter values to obtain the most accurate (and beautiful) 2D attractor, that represents the dynamics of the recorded system at that particular moment in time.
These attractors are highly informative and meaningful, and many recent analysis approaches are based on them, including algorithms to measure the entropy and fractal dimension of the signal. Some features can also be gauged by the naked eye. Different types of attractors shape have been described, such as:
- Fixed point attractors: The trajectory converge towards a single fixed point where the system is at equilibrium.
- Periodic attractors: Also referred to as limit cycle, these attractors are usually associated with periodic (oscillating) signals.
- Toroidal: A Torus-shaped (Bagel) attractor, usually suggesting multiple frequencies in the periodic trajectory.
- Strange attractors: An attractor is called “strange” if it cannot be described using simple shapes (circle, sphere, …). Famous strange attractors can be made using Lorenz', Rössler’s or Clifford’s equations.
Contact
For appointements or information, please contact me at:
