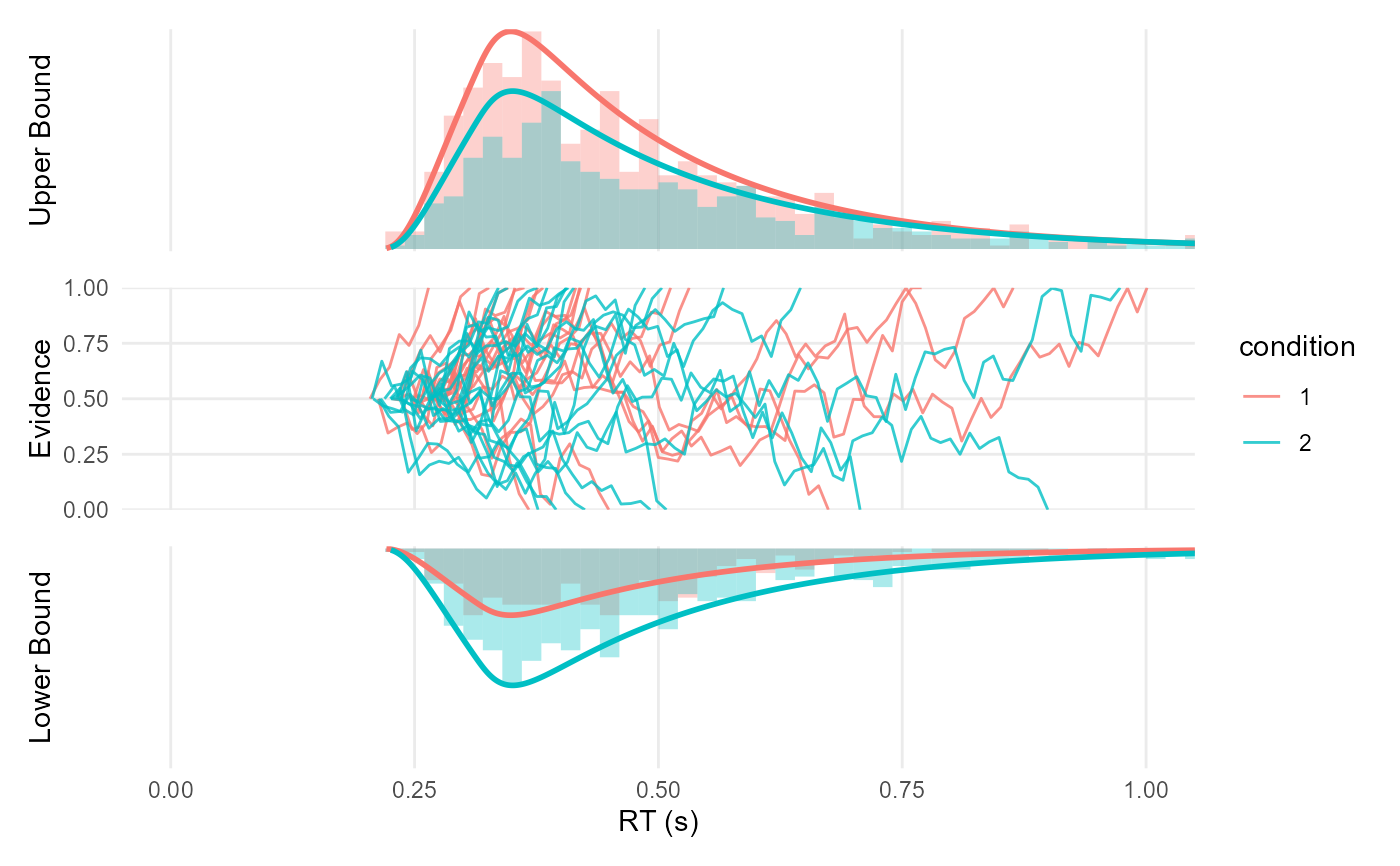
Plot DDM Data
ddm_plot.RdPlot data.
Usage
ddm_plot(data, ...)

ddm_plot_upper(
  data,
  density = NULL,
  xlim = c(0, 2),
  hist_alpha = 1/3,
  density_linewidth = 1,
  theme = "default",
  ...
)

ddm_plot_lower(
  data,
  density = NULL,
  xlim = c(0, 2),
  hist_alpha = 1/3,
  density_linewidth = 1,
  theme = "default",
  ...
)

ddm_plot_traces(
  traces,
  trace_alpha = 0.8,
  trace_linewidth = 0.5,
  xlim = c(0, 2),
  theme = "default",
  ...
)
Arguments
- data
Either object from
ddm_data()) or dataframe containing columns "rt", "response" (lower or upper) and "condition".- ...
Other arguments to pass to other functions, such as additional controls to
hist().- density
Data for density lines (typically obtained from
ddm_data()).- xlim
X-axis limits.
- theme
Can be
NULL(useful for customizing) or "default".- traces
Data for trace lines (typically obtained from
ddm_data()).- trace_alpha, hist_alpha
Alpha of trace lines or histograms.
- trace_linewidth, density_linewidth
Alpha of trace lines or histograms.
Examples
library(ggplot2)
#> Warning: package 'ggplot2' was built under R version 4.2.2
library(patchwork)

# Simulate data
sim <- ddm_data(n=1000, drift = c(1, 0), n_traces = 20)

ddm_plot(sim, xlim = c(0, 1))


# Customize
data <- sim$data
density <- sim$density
traces <- sim$traces

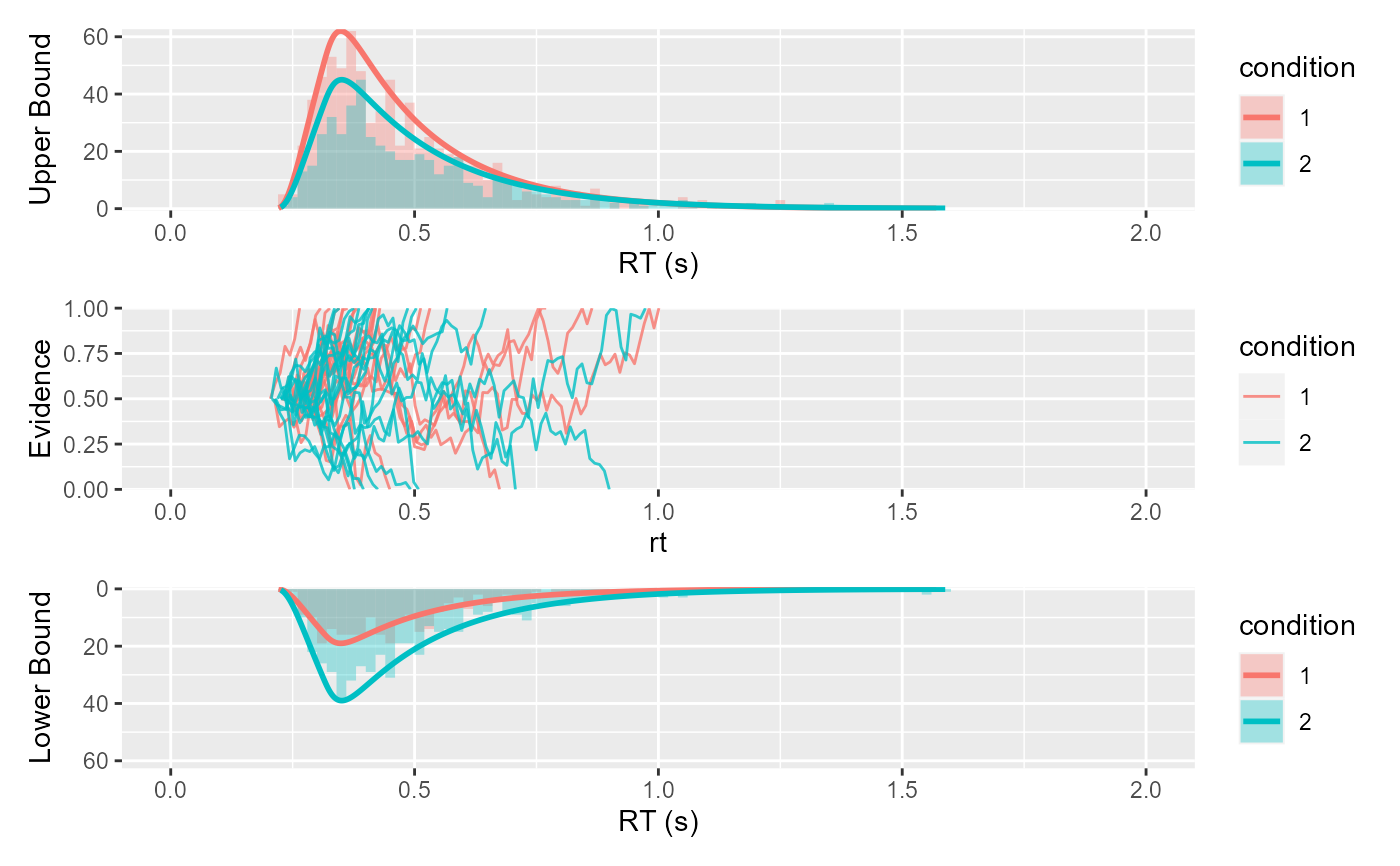
ddm_plot_upper(data, density = density, theme = NULL) /
  ddm_plot_traces(traces, theme = NULL) /
  ddm_plot_lower(data, density = density, theme = NULL)
