How to share data analysis scripts with publications?
Including data analysis as Supplementary Materials can be a tedious task.
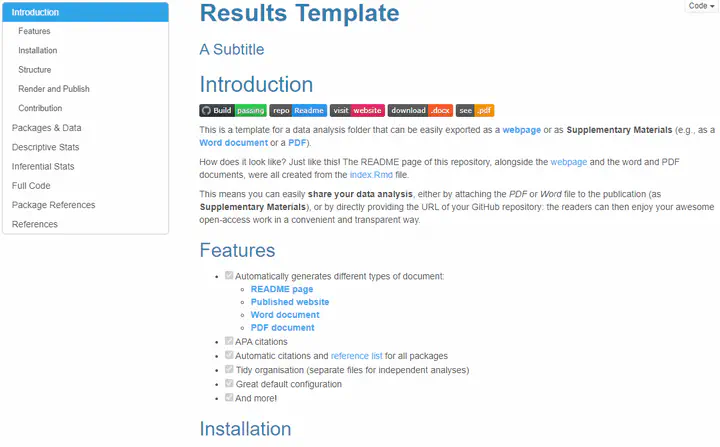
 The website with the analysis, automatically created from the script.
How to share data analysis scripts with publications?
Including data analysis as Supplementary Materials can be a tedious task. How can we simplify the sharing of our work? So that it can be fully appreciated, as well as evaluated, improved, worked on, in a transparent and open way?
Option 1: Dump the code in a word file
Most publication portals don’t directly accept code scripts to be included “as is”. In other words, you cannot upload your manuscript and your .R script just like that. So one option is to copy its content, paste it in a word / pdf document, and Voilà!
But what if you don’t have code because you use a point-and-click software? Well, you can note down all the x,y coordinates of your clicks so that one can reproduce the steps and all the clicks. Just kidding, if you don’t have a script, then may god have mercy on your soul.
Why is that a terrible solution? Because let’s face it, unstructured code dumps are horrific. Nobody wants to read it, it does not make justice to your work, and it’s still tedious to create! You have to re-do it everytime you modify your code. And it’s even worse if you want to include all the outputs, figures, tables that are generated by the code? Data analysis is not just the code, but everything that comes with it and that allowed you to make the conclusions that you made.
Option 2: Use Rmarkdown
Rmarkdown is a “framework” that allows you to have files (.Rmd) that can contain a mix of text and code (and not only R, but also Python for instance!).
It can be used to write comprehensive “reports” that include all your thoughts, motivations and interpretations of the results. And the great thing about it is that these files can be converted into beautiful and readable documents like PDF, Word or HTML. It will automatically embed the code and its generated output (as text, tables or figures) alongside the text.
It is an awesome way to write statistical reports, and can even be used to create many other non-stats related stuff, like APA-formatted manuscripts (great for preprints), books, presentation slides, websites or blogs. It’s a must-have skill for every researcher.
And it gets better!
Option 3: Use our Results Template
In the Reality Bending team, we like to have our different projects and studies organized in a consistent way. We heavily use GitHub to store our projects and collaborate on them, and we also like the possibility of making these projects open and accessible (i.e., easy to discover and explore) when the time comes.
That’s why we came up with a Template folder for storing the materials related to a given study, including well-organized analysis scripts. And what’s great about it is that it is setup in a way that allows you to generate multiple files format (word, pdf, html) with a single click (and even without any click, in a fully automatic way)! And what’s even greater is that if you decide to upload it to GitHub, you’ll have a whole website presenting your data analysis!
We use it to have reproducible analysis that we can easily share with publications. We can upload the .pdf or .docx file generated by the template as Supplementary Materials, but we also link the URL of the online repository of the study in the manuscript, where users can access and experience the content in the format that they prefer. It really improves the appeal of a study when the results are trustworthy.
All this is easily made possible with our template. Check it out here:
👉 https://github.com/RealityBending/TemplateResults 👈
☝️☝️☝️☝️☝️☝️☝️☝️☝️☝️☝️☝️☝️☝️☝️☝️☝️☝️☝️☝️☝️☝️☝️☝️☝️☝️☝️☝️☝️
And let us know what you think! You can open an issue on the repo or even contribute to help us improve it :)
Thanks for reading! Do not hesitate to tweet and share this post, and leave a comment below 🤗
🐦 Don’t forget to join me on Twitter @Dom_Makowski