6 Generative Models
![]()
In this chapter, we will move away from statistical models that describe the data to models of data-generation processes.
6.1 Evidence Accumulation
In the previous chapter, we introduced the Wald distribution and its parameters, nu \(\nu\) (drift rate) and alpha \(\alpha\) (threshold). This distribution appears to have been first derived in 1900 to model the time a stock reaches a certain price (a threshold price) for the first time, and used in 1915 by Schrödinger as the time to first passage of a threshold of a Brownian motion (i.e., a random walk).
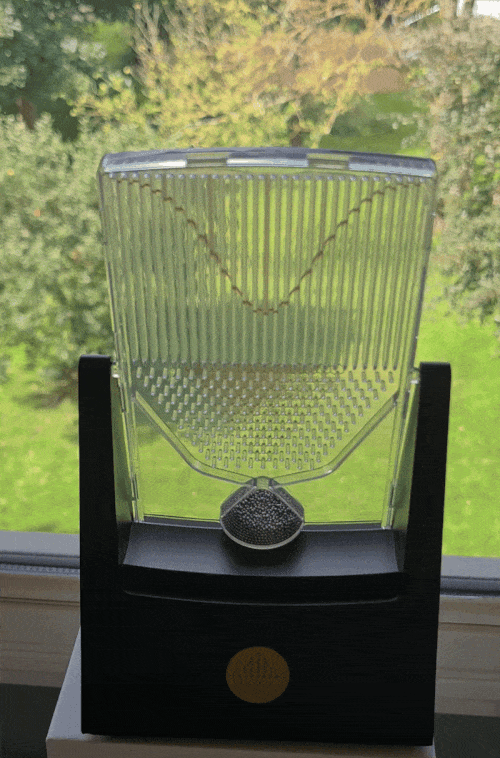
A random walk describes a path consisting of a succession of random steps. It has been used by Francis Galton in 1894 to illustrate the Central Limit Theorem, and is now known as the Galton Board. The Galton Board is a physical model of a random walk, where balls are dropped from the top and bounce left or right at each peg until they reach the bottom. The distribution of the final position of the balls is a normal distribution.
TODO: Replace with my own video.
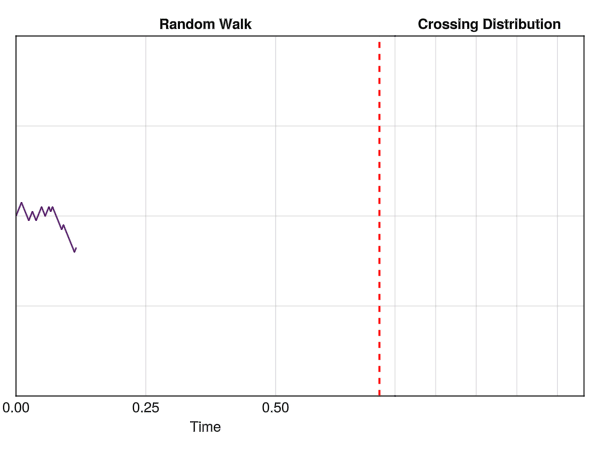
In the figure below, we can see a computer simulation illustrating the same concept, with “time” being displayed on the x-axis. All iterations start at y=0, and change by -1 or +1 at each time step, until it reaches a threshold of t = 0.7 seconds.
Random walks are used to model a wide range of phenomena, such as the movement of particules and molecules, the stock market, the behavior of animals and, crucially, cognitive processes. For instance, it can be used to approximate evidence accumulation: the idea that a decision maker (be it a Human or any other system) accumulates evidence in a “stochastic” (i.e., random) fashion over time until a certain threshold is reached, at which point a decision is made.
6.2 Wald Distribution (Revisited)
This is how the Wald distribution is actually generated. It corresponds to the distribution of times that it takes for a stochastic process to reach a certain threshold \(\alpha\) (a certain amount of “evidence”). The twist is that the process underlying this model is a random walk with a drift rate \(\nu\), which corresponds to the average amount of evidence accumulated per unit of time. In other words, the drift rate \(\nu\) is the “slope” of the evidence accumulation process, representing the strength of the evidence (or the speed by which the decision maker accumulates evidence). The threshold \(\alpha\) is the amount of evidence required to reach a decision (“decision” typically meaning making a response).
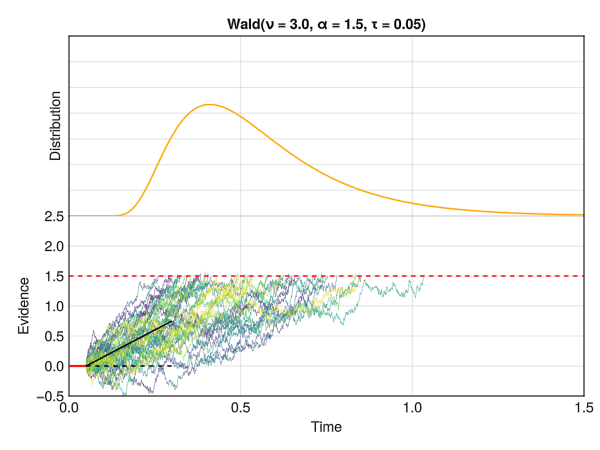
In this figure, the red line at 0 represents the non-decision time tau \(\tau\). The dotted red line corresponds to the threshold \(\alpha\), and the drift rate \(\nu\) is the slope of the black line. The time at which each individual random accumulator crosses the threshold forms a Wald distribution.
As you can see, the Wald distribution belongs to a family of models thata do not merely attempt at describing the empirical distributions by tweaking and convolving distributions (like the ExGaussian or LogNormal models). Instead, their parameters are characterizing the data generation process.
While such “generative” models offer potential insights into the cognitive processes underlying the data, they inherently make strong assumptions about said underlying process (for instance, that the data of a task can be approximated by a stochastic evidence accumulation process). It is thus crucial to always keep in mind the limitations and assumptions of the models we use. Don’t forget, with great power comes great responsability.
6.3 Drift Diffusion Model (DDM)
Interestingly, the Wald model is actually a special case of a more general type called the Drift Diffusion Model (DDM) (named as such because the evidence accumulation is assumed to be a “diffusion” process, i.e., a random walk). One of the main difference is that in the Wald model, the drift rate \(\nu\) must be positive, as it tracks the time taken by the diffusion processes to reach only one “positive” threshold \(\alpha\).
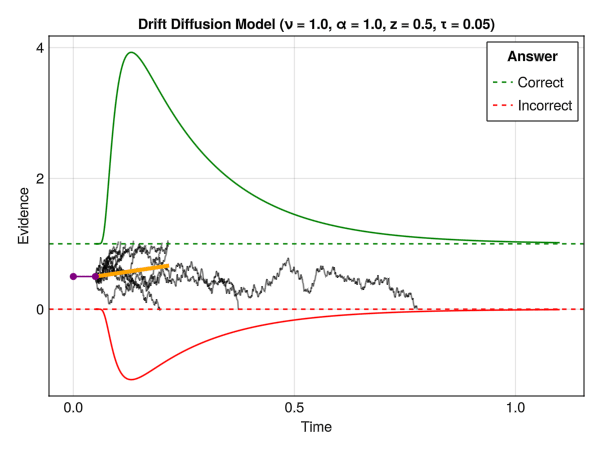
But what happens if we relax this and allow the drift rate to be null or negative? Many traces might never reach the upper threshold, and might instead reach high “negative” values. The idea is then to also consider a lower threshold, which would correspond to a different response. Finally, one could also modulate the starting point of the process relative to the thresholds (i.e., how close to the upper or lower threshold the accumulation process starts). This is, in essence, the core idea behind the Drift Diffusion Model.
Drift Diffusion Models are useful to jointly model RTs and a binary outcome, such as 2 different choices or accuracy (e.g., “correct” vs. “error”). They allow, in theory, to delineate various cognitive processes, such as the speed of evidence accumulation (drift rate), the amount of evidence required to make a decision (threshold), and the starting point of the accumulation process (bias).
The parameters are:
- Nu \(\nu\) : The drift rate (also sometimes denoted delta \(\delta\)), representing the average slope of the accumulation process towards the boundaries. The larger the (absolute value of the) drift rate, the more effective the evidence accumulation for the corresponding response option. A drift rate close to 0 suggests an ambiguous stimulus. Typical range: [-5, 5].
- Alpha \(\alpha\) : The boundary separation threshold is the distance between the two decision bounds (lower bound being at 0 and upper bound at alpha \(\alpha\)). It has been interpreted as a measure of response caution (i.e., of speed-accuracy trade-off, with high alpha \(\alpha\) being related to high accuracy). It represents the amount of evidence that is needed to make a response. Typical range: [0.5, 2].
- Beta \(\beta\) : The initial bias towards any of the responses. The starting point of the accumulation process (in percentage of alpha \(\alpha\): if \(\alpha = 2.0\) and \(\beta = 0.5\), then the actual starting point is \(2.0*0.5=1\)). Typical range: [0.3, 0.7].
- Tau \(\tau\) : The non-decision time. It represents all non-decisional process, such as stimulus encoding, motor processes, etc. Typical range (in seconds): [0.1, 0.5].
This basic model is sometimes referred to as a Wiener model, as expanded versions of the DDM exist with additional parameters (e.g., variability of the drift rate).
6.4 Linear Ballistic Accumulator (LBA)
TODO.
6.5 Other Models (LNR, RDM)
TODO.
6.6 Including Random Effects
6.6.1 Random Intercept
TODO.
6.6.2 Random Slopes
TODO.
6.6.3 Performance Tips
TODO.
6.7 Additional Resources
- Lindelov’s overview of RT models: An absolute must-read.
- De Boeck & Jeon (2019): A paper providing an overview of RT models.
- https://github.com/vasishth/bayescogsci
- An expert guide to planning experimental tasks for evidence accumula6on modelling (Boag, 2024)